My Kubernetes Dashboard and How To Deploy Yours
My experiences with the Kubernetes Dashboard and a step-by-step tutorial on how you can deploy your own instance on your Raspberry Pi Kubernetes cluster.

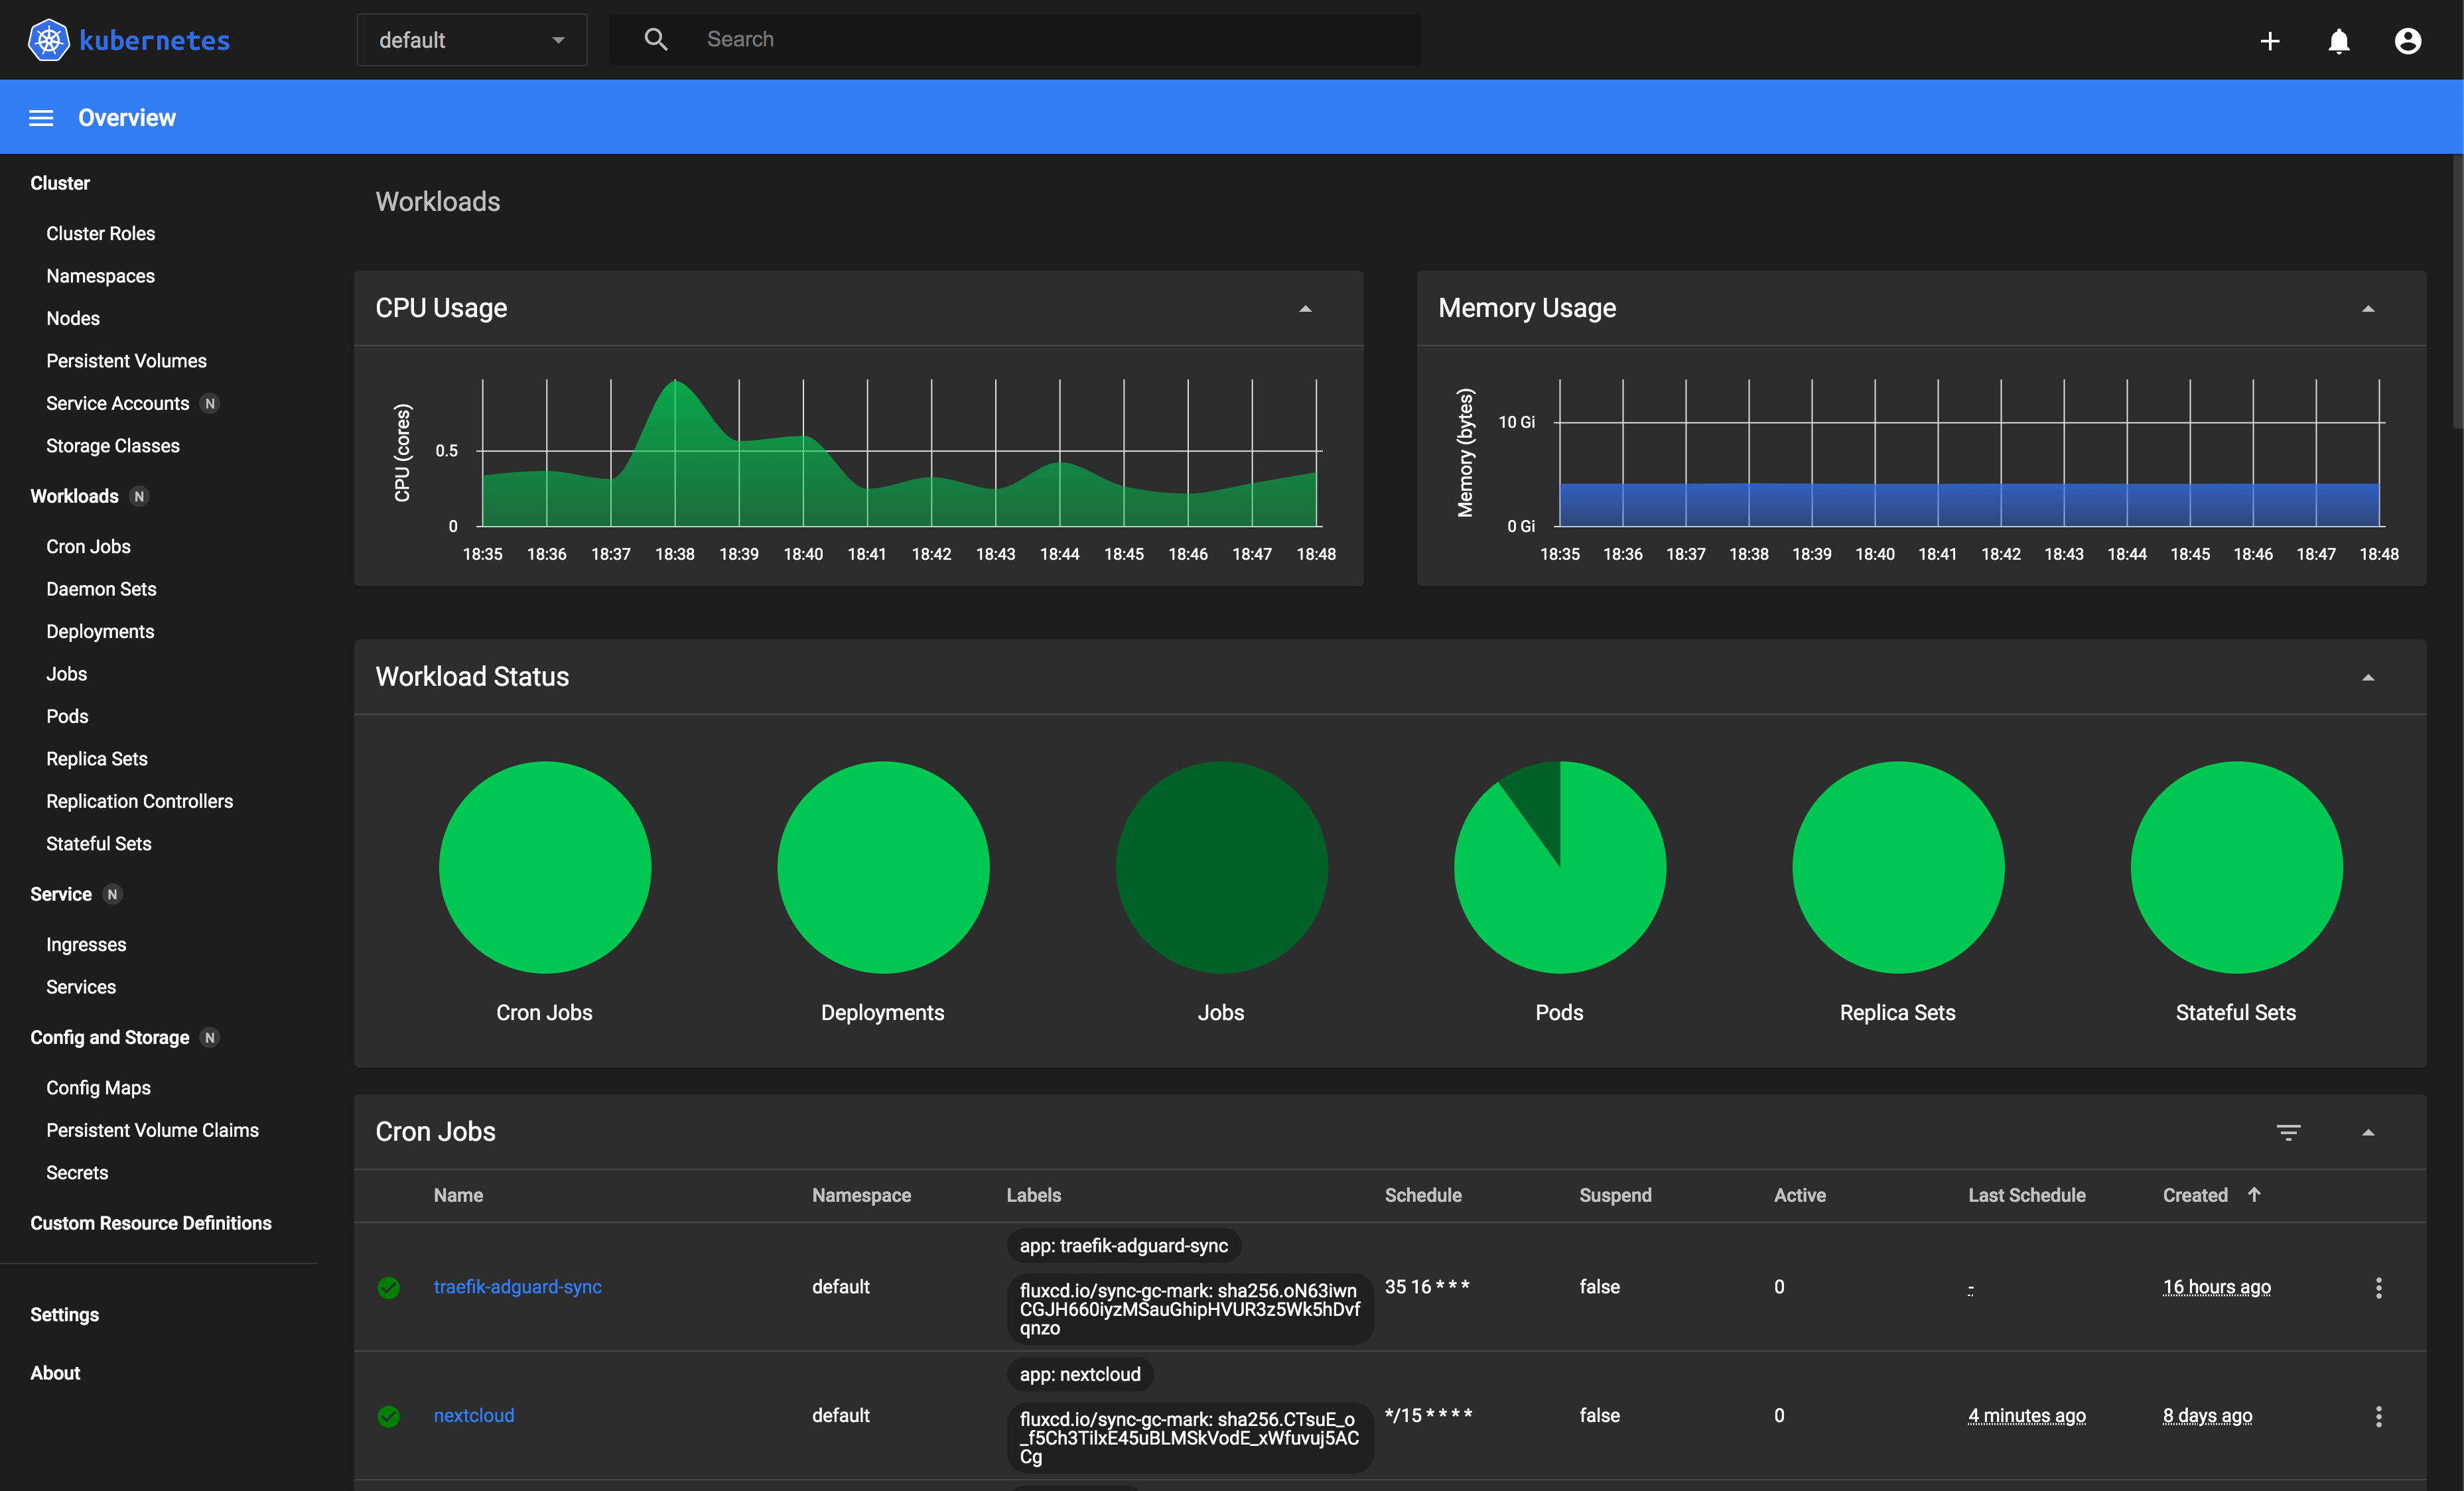
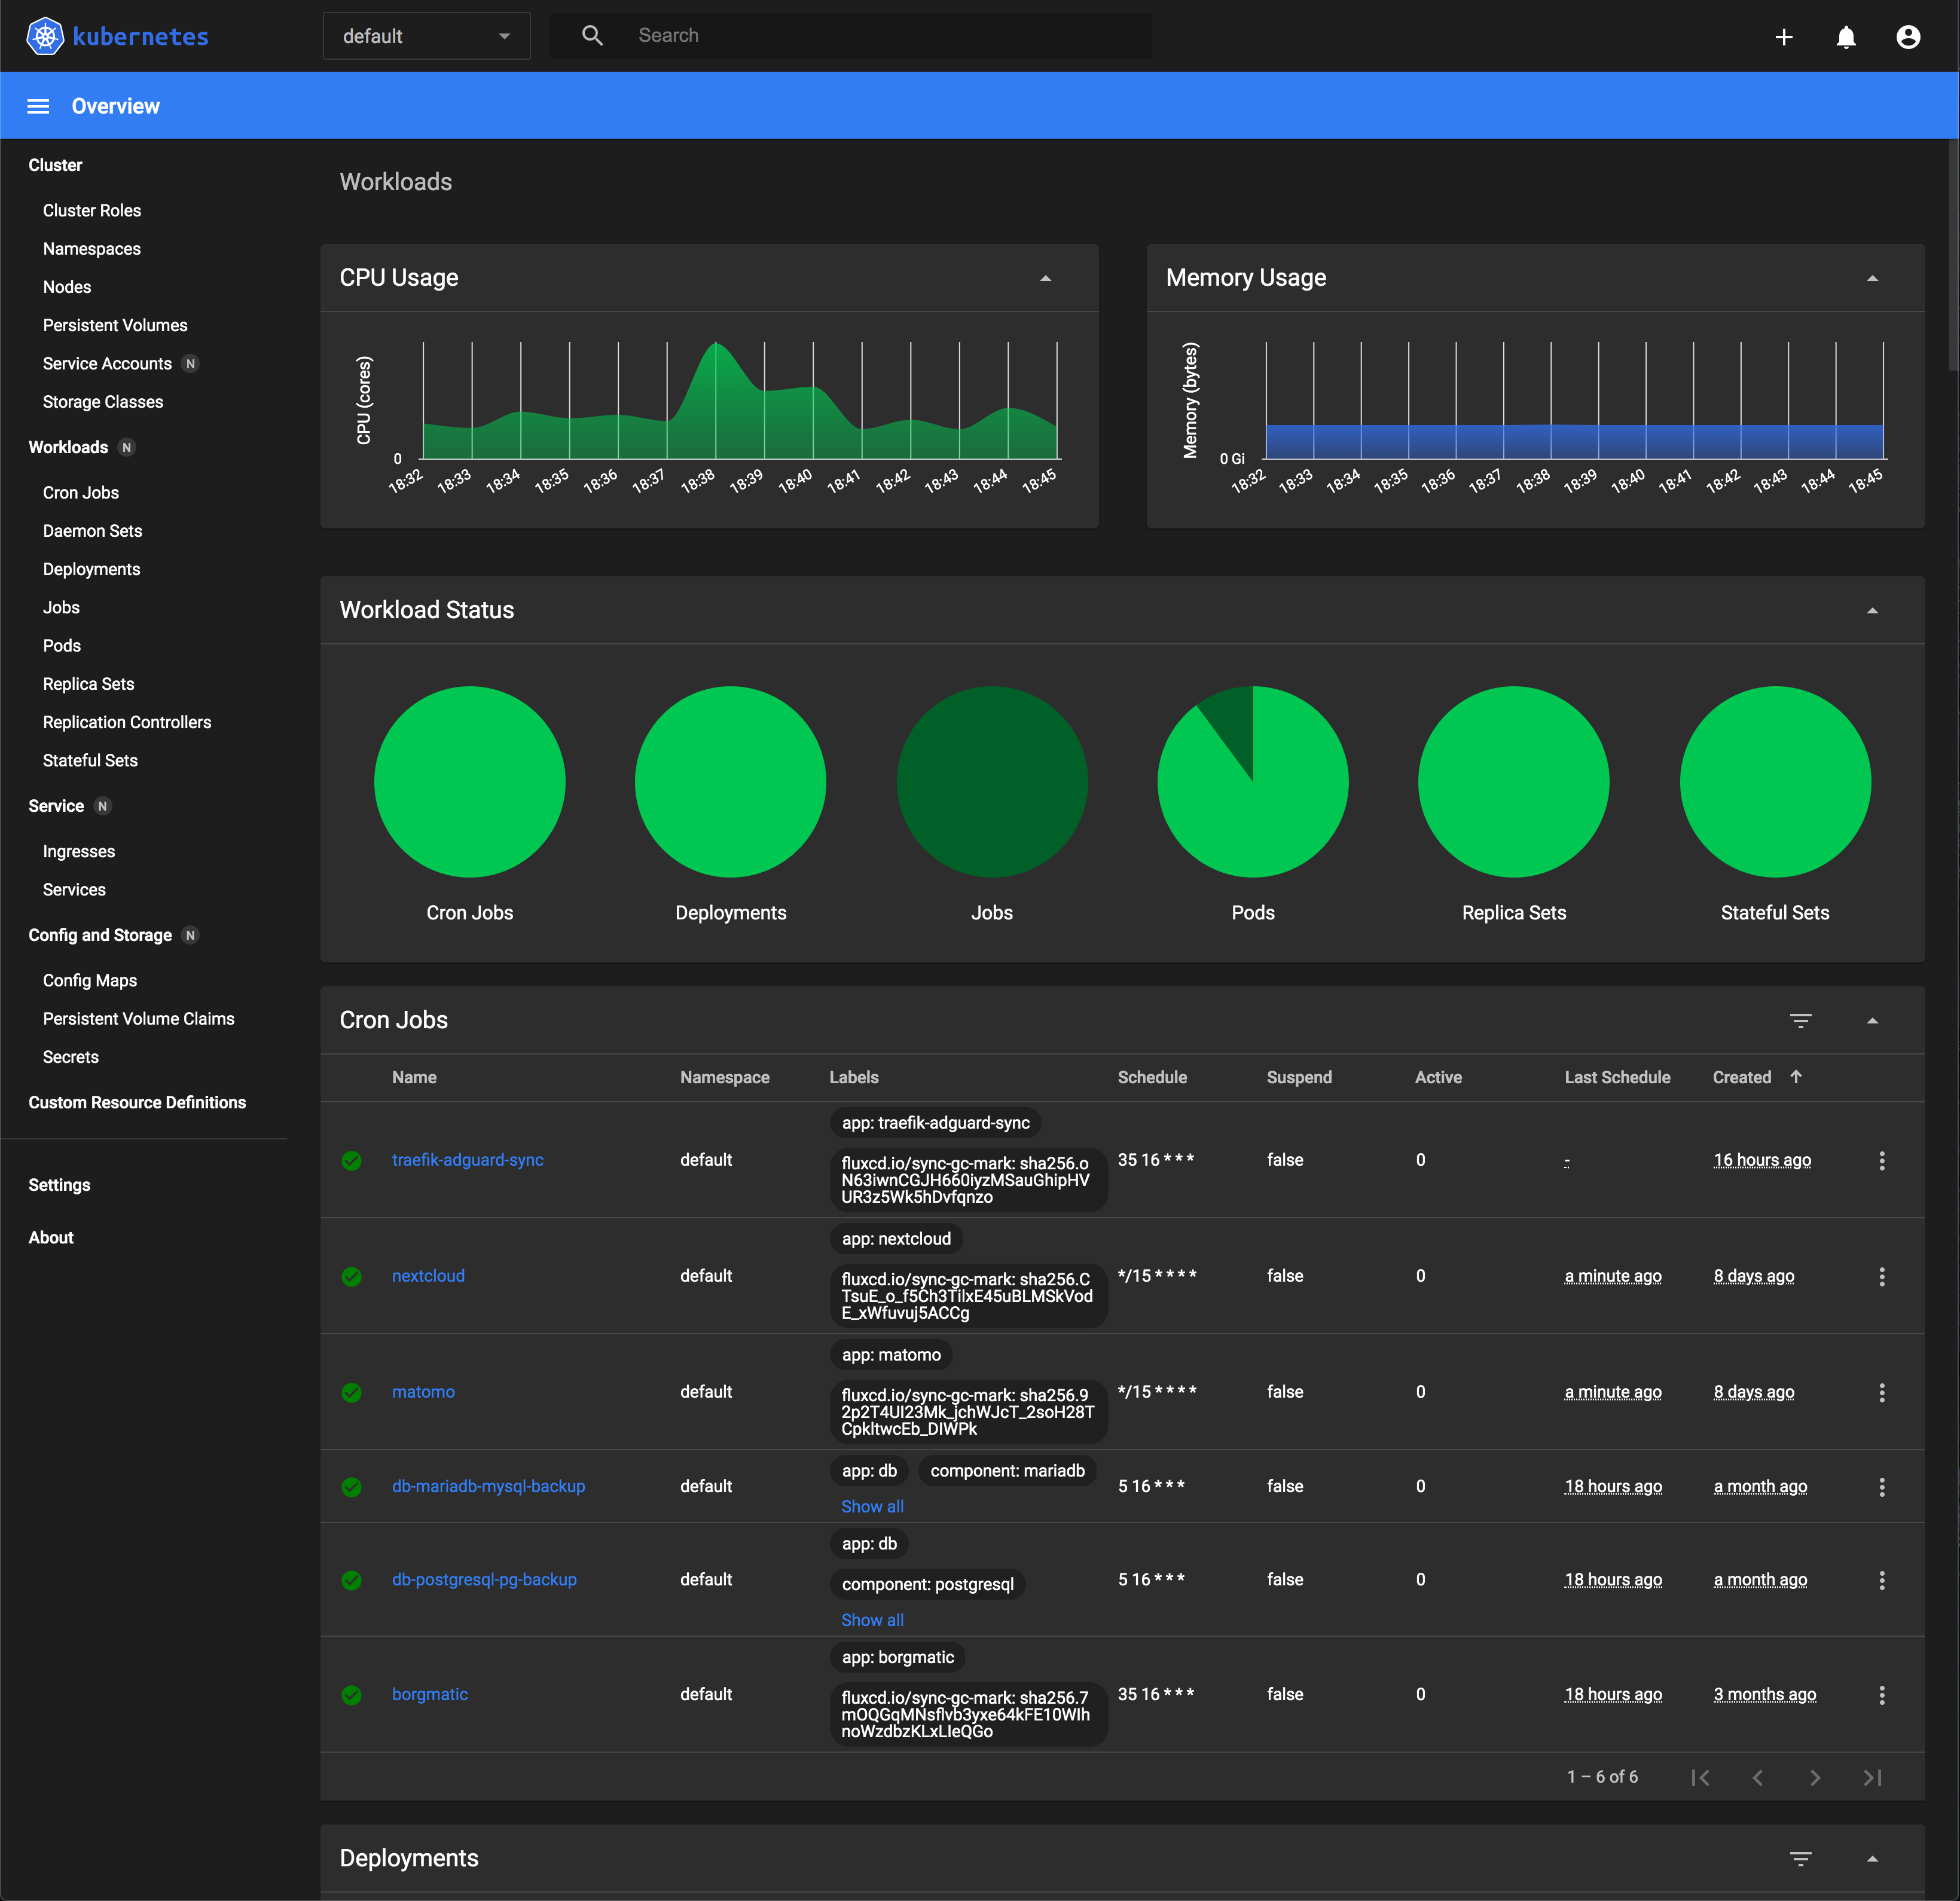
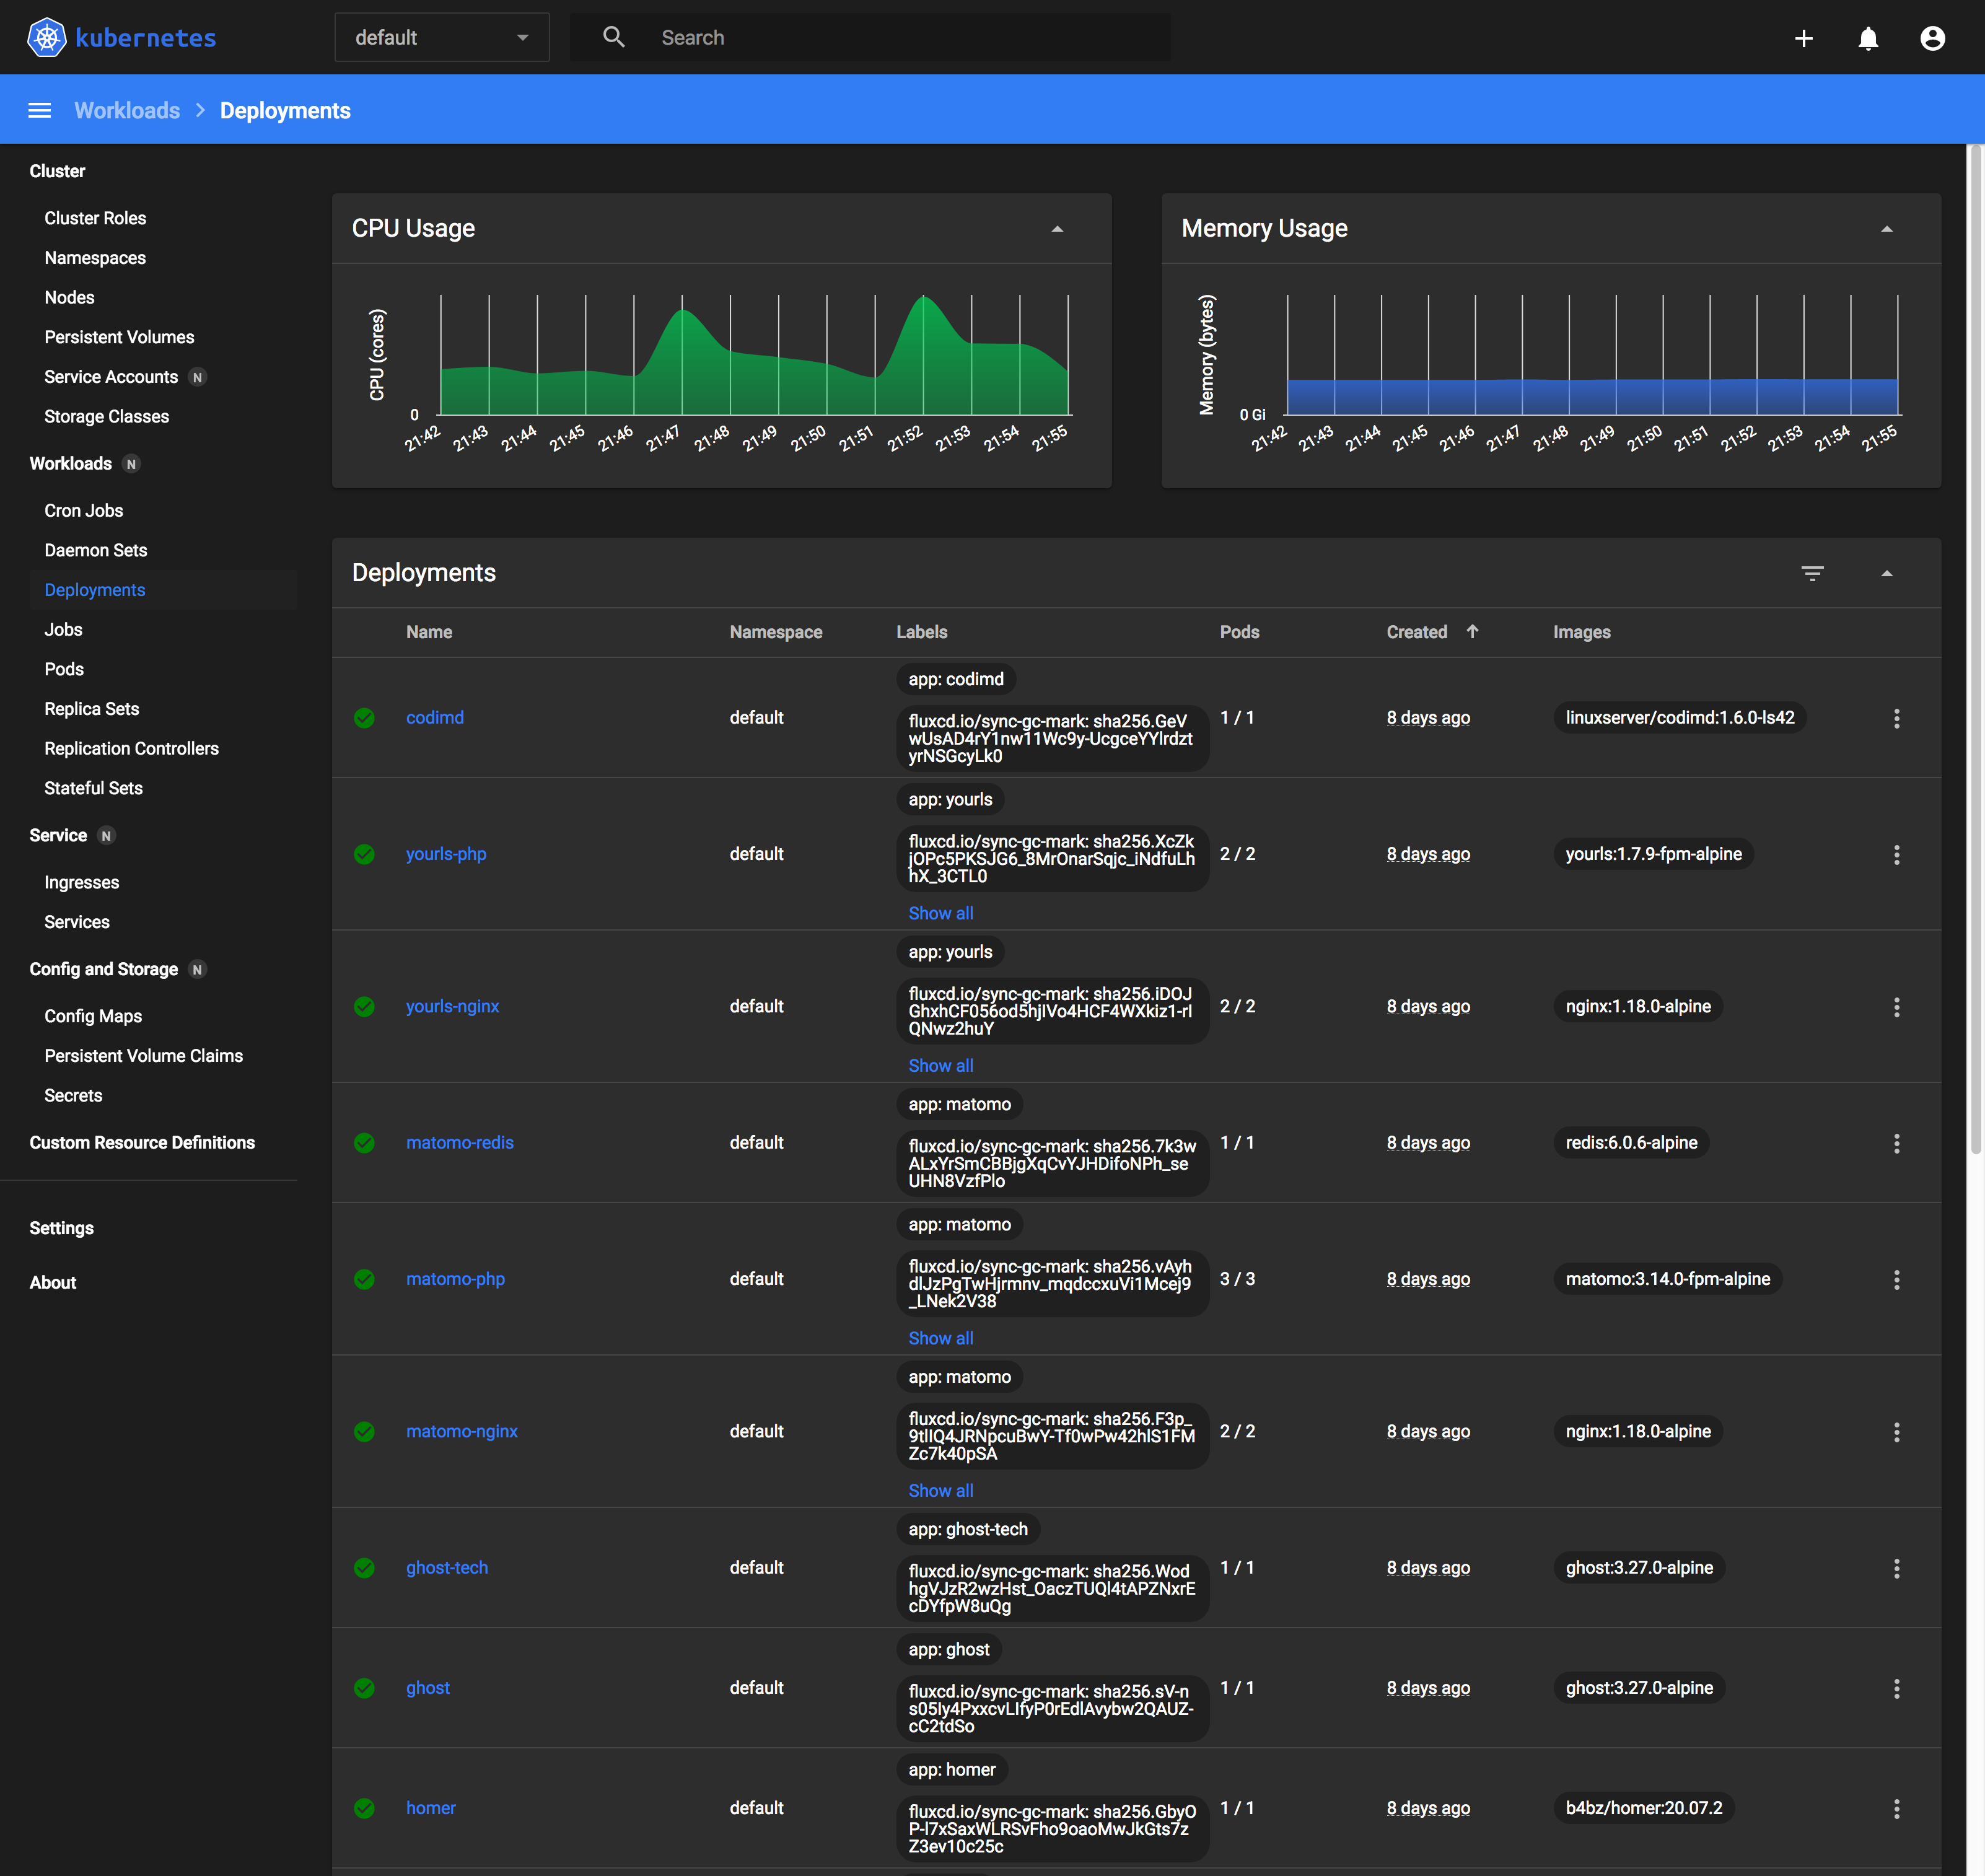
The Kubernetes Dashboard is essentially a web UI for managing the Kubernetes cluster that it is deployed on. It allows the administrator to perform CRUD (Create, Read, Update, Delete) operations on the most commonly used cluster resources.
Less commonly used resources such as LimitRange and HorizontalPodAutoscaler, you'll still have to fallback to the command line to manage them. In the screenshot you can already see all the resources you can manage within the UI in the sidebar on the left.
The dashboard has just reached 2.0.0 a few months back after staying in 2.0.0-beta for almost a year. Though there still are some rough edges that can be ironed out, I feel it is sufficiently stable for production usage.
In my opinion, this should be the first application to deploy on a new cluster for both beginners and experienced users alike.
Most useful features
Here are the top 3 features that I find most useful, and screenshots of their corresponding views on the dashboard.
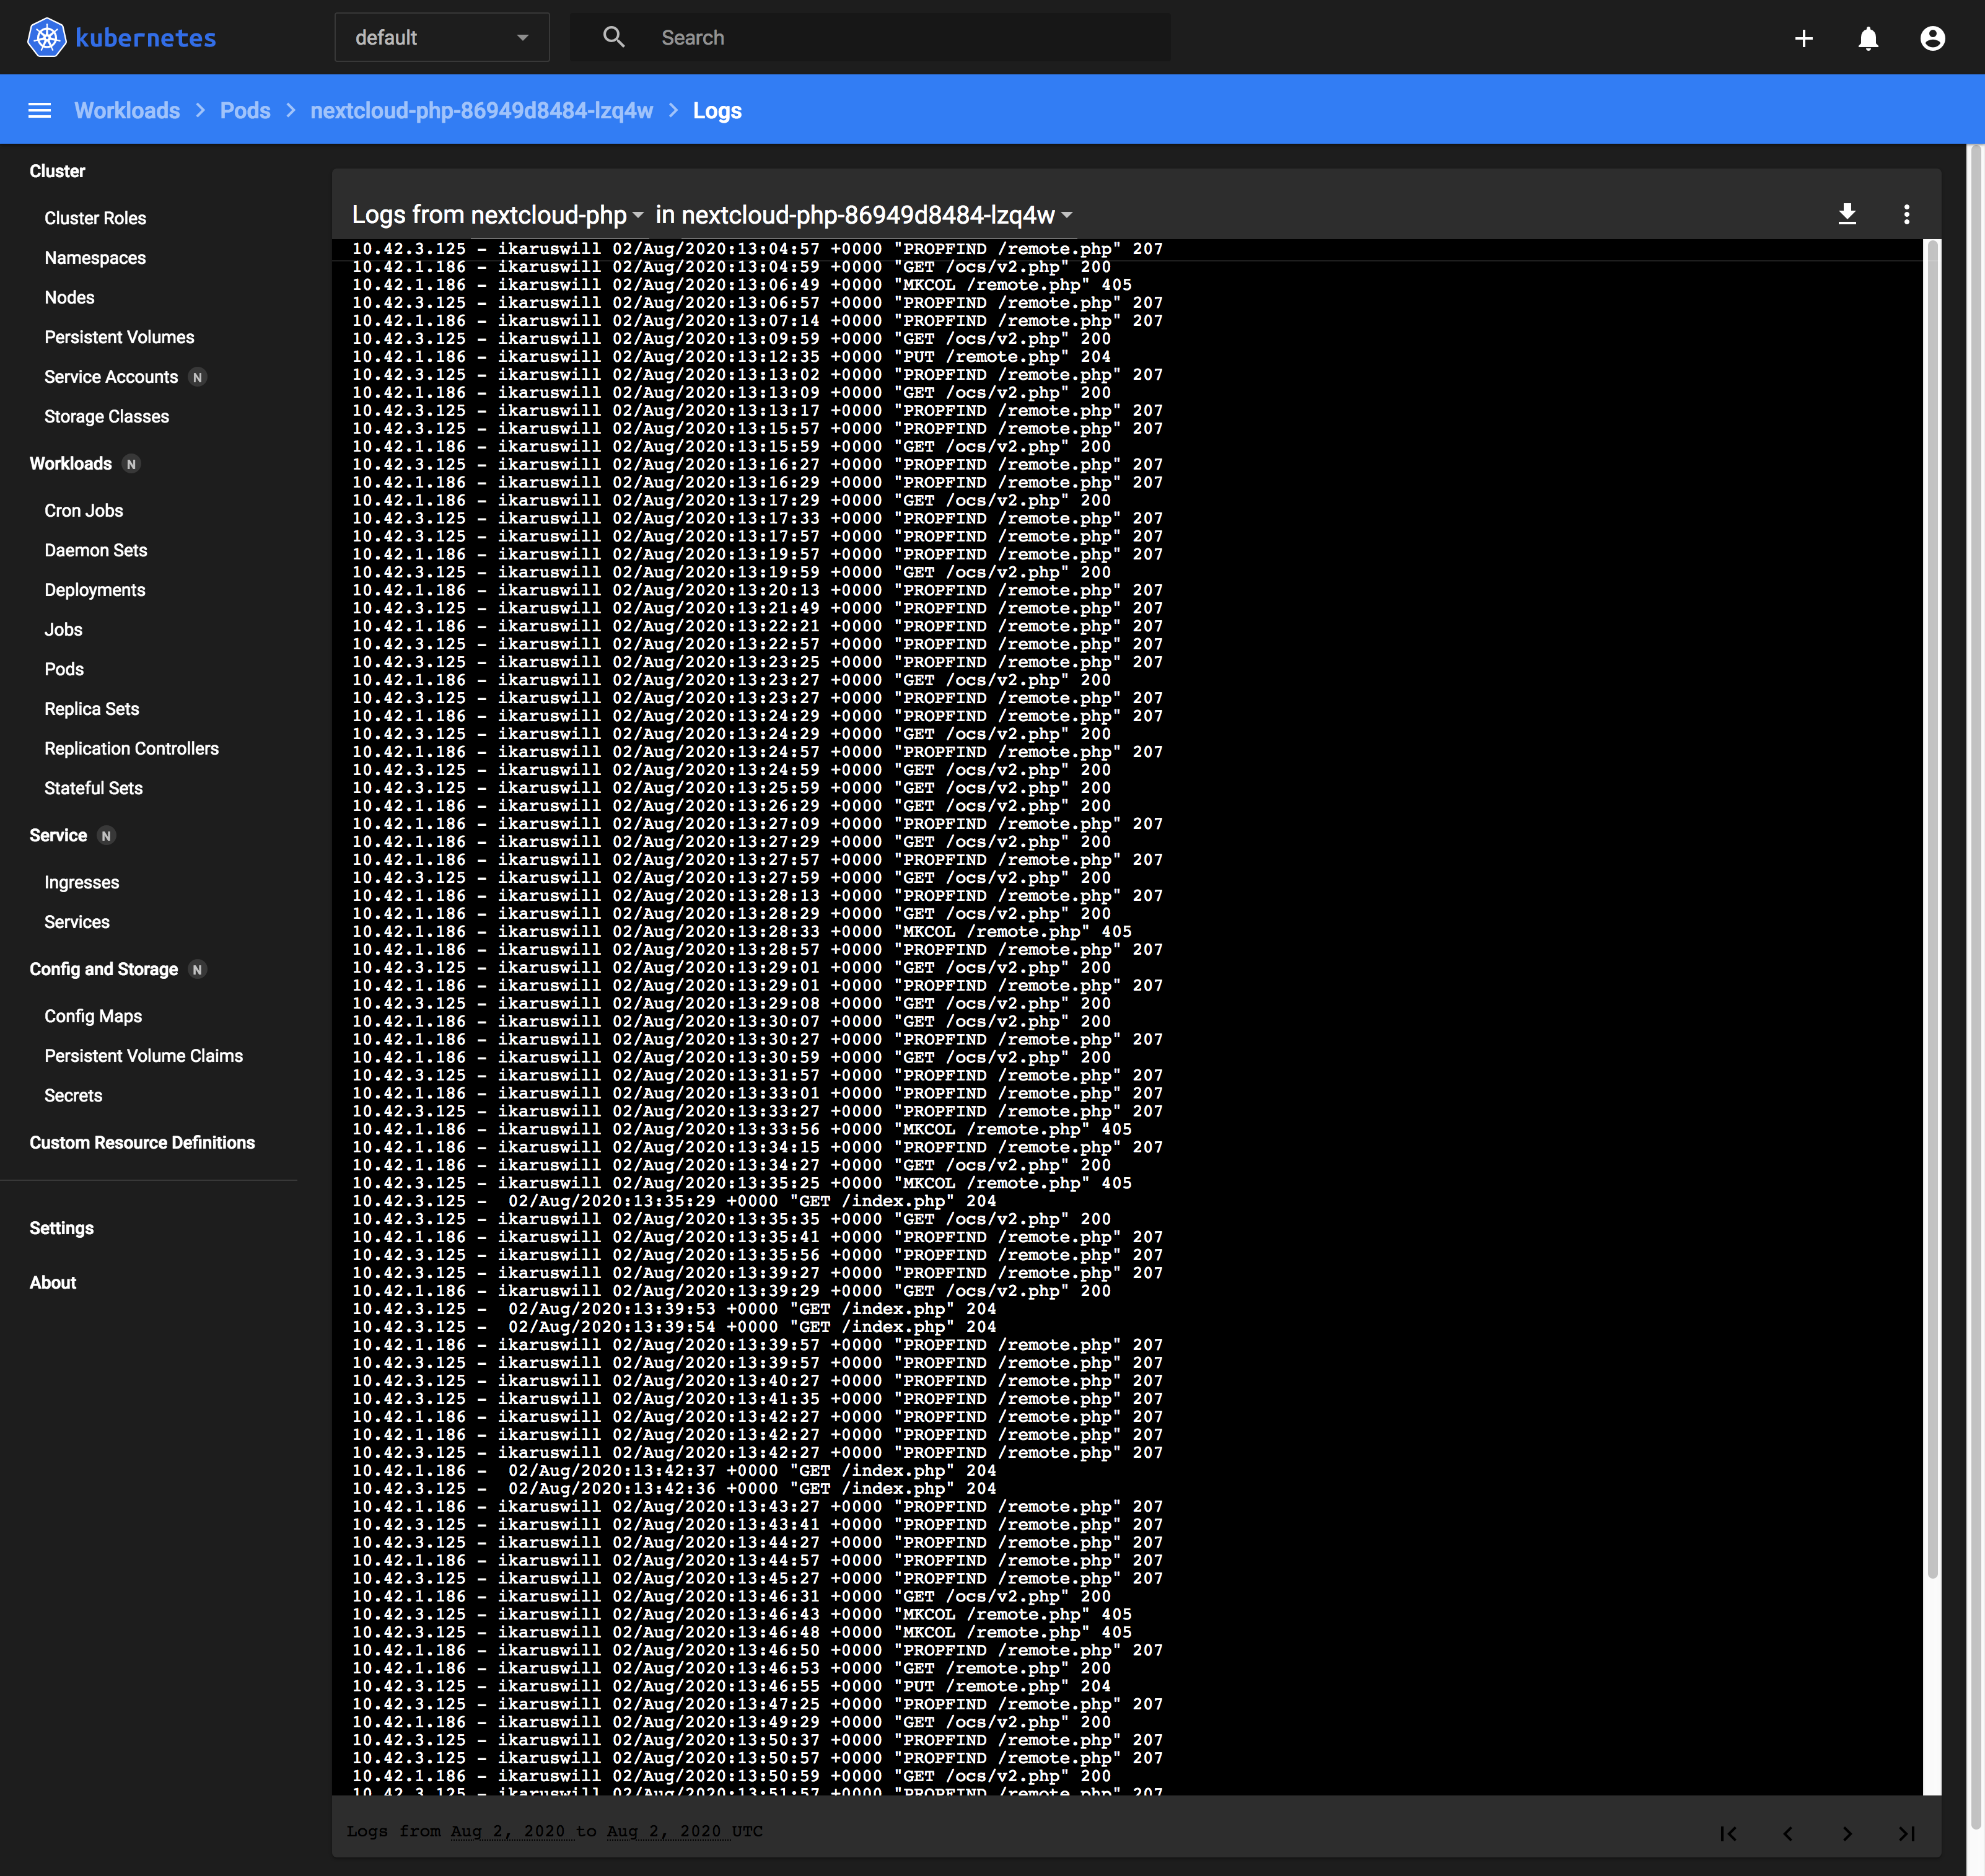
Viewing pod logs that auto-refreshes every few seconds
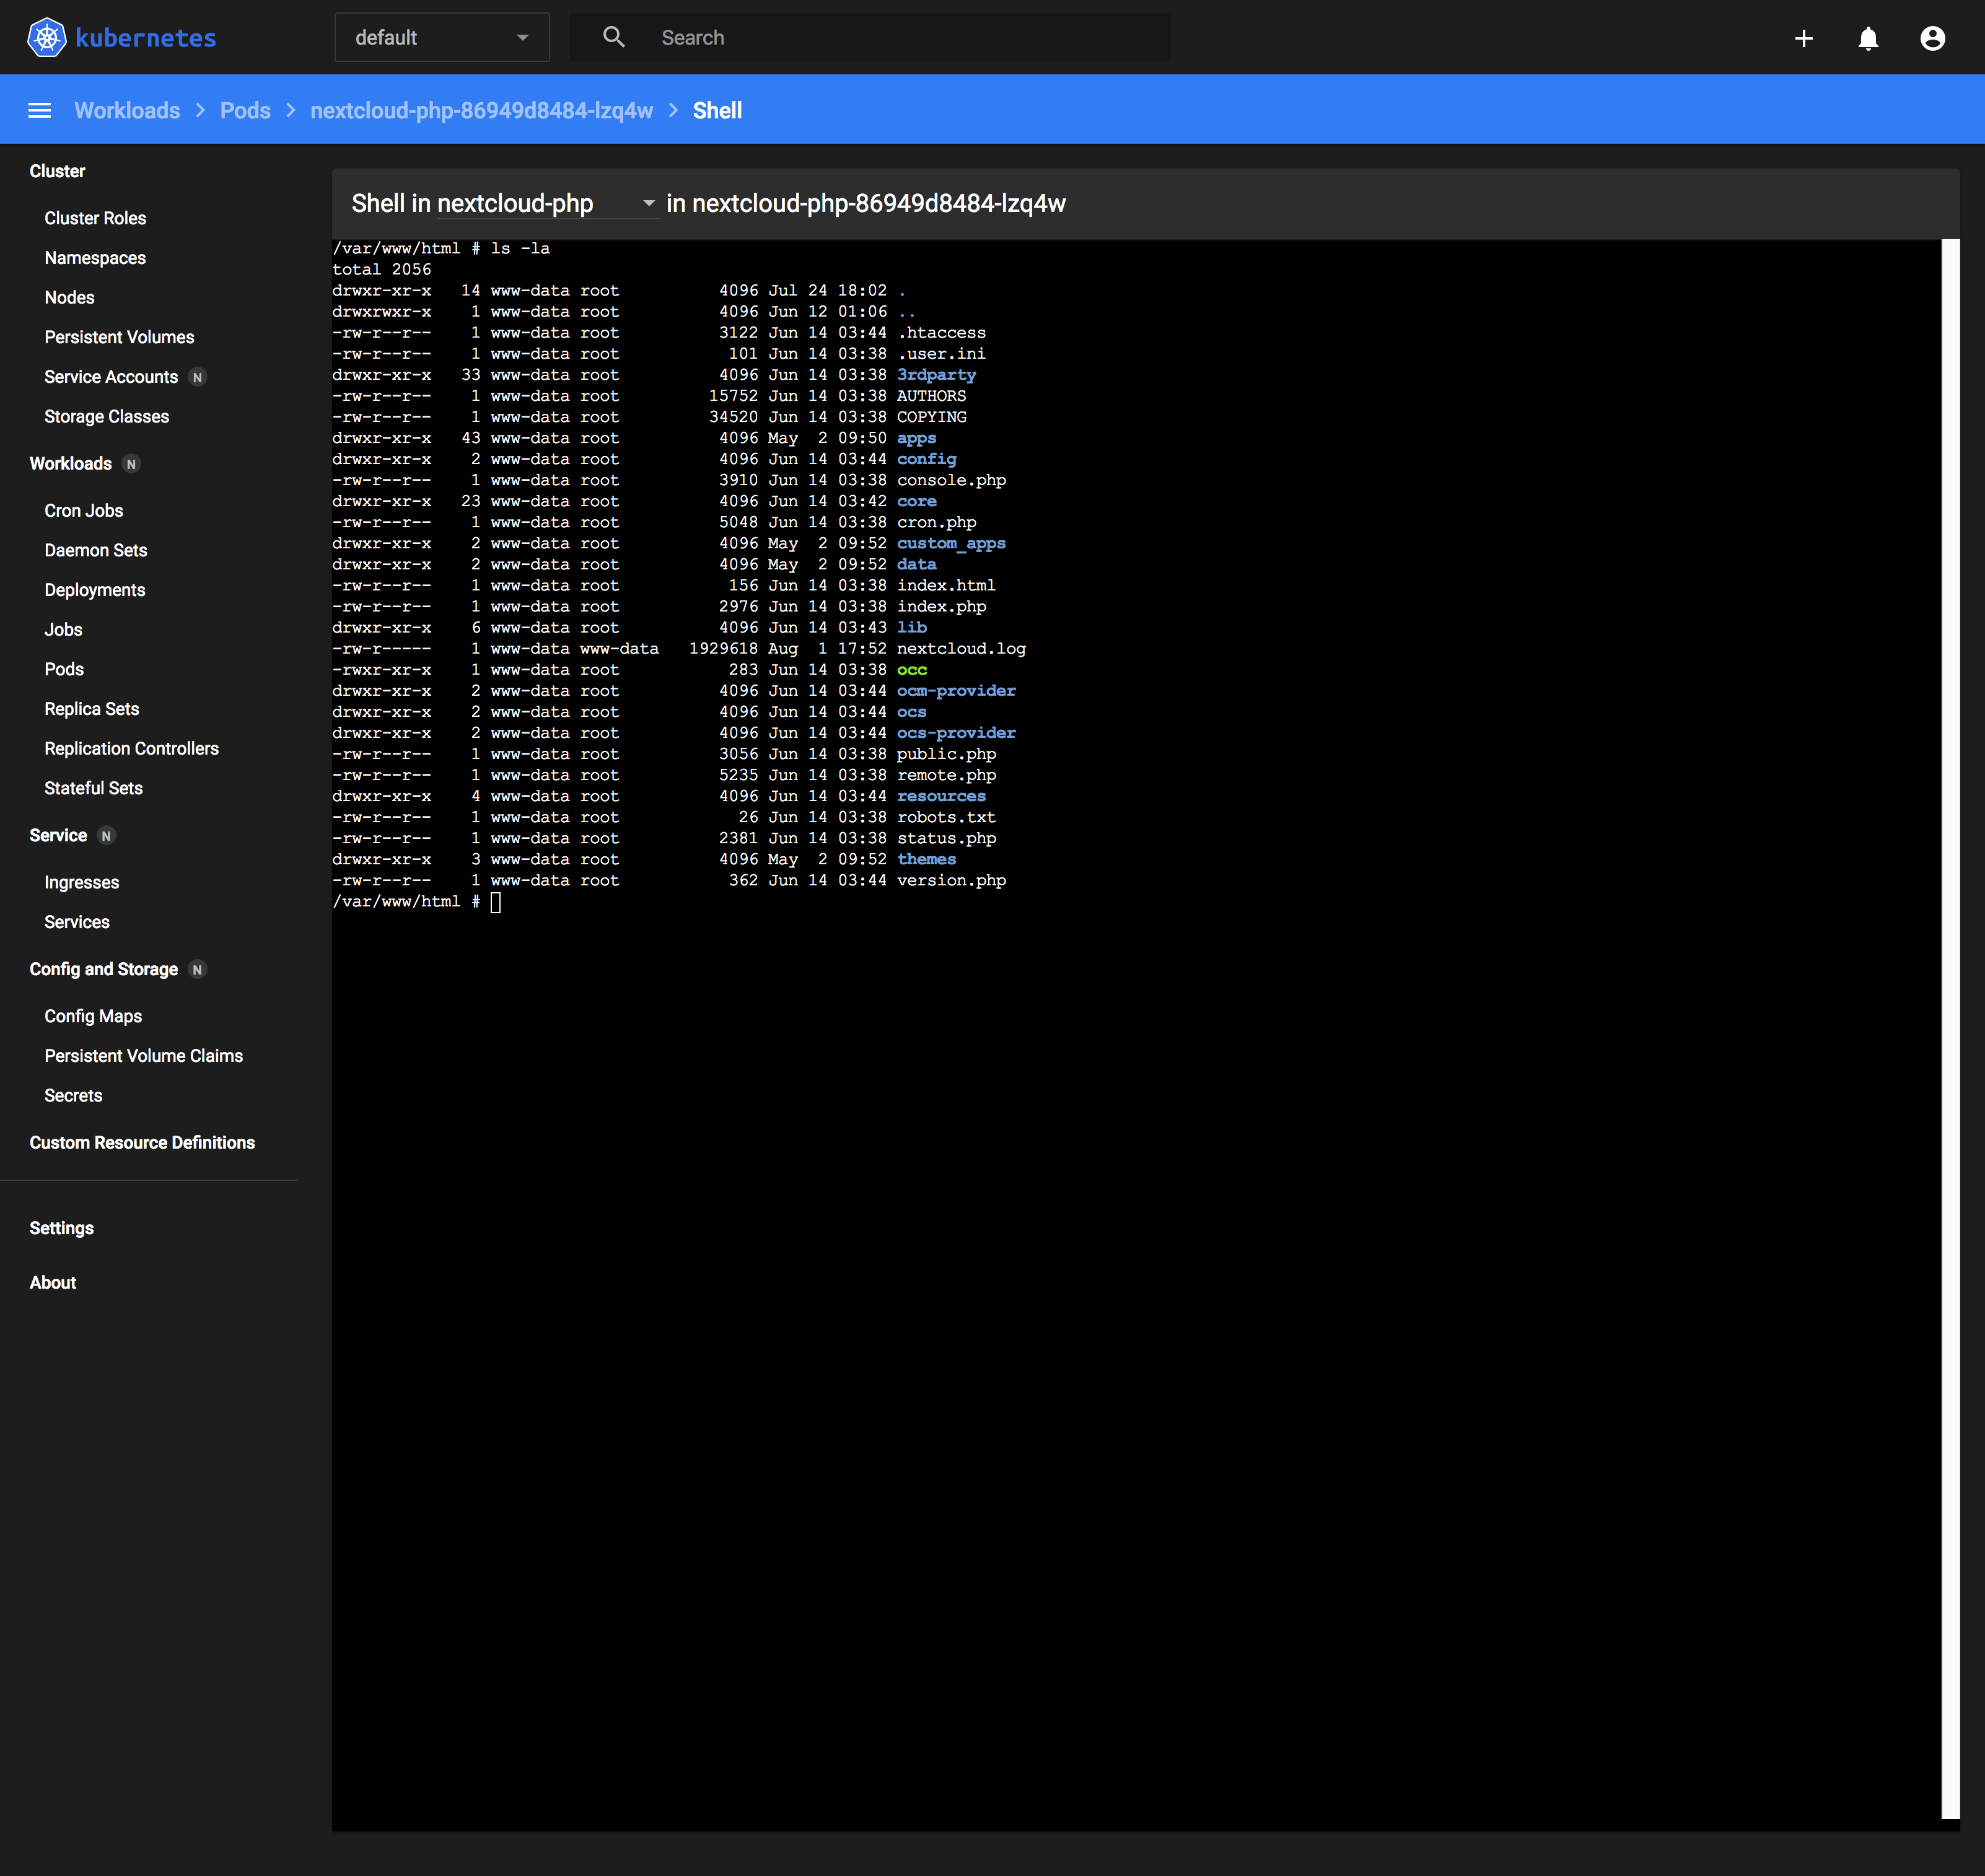
Opening a shell session into any container to run commands
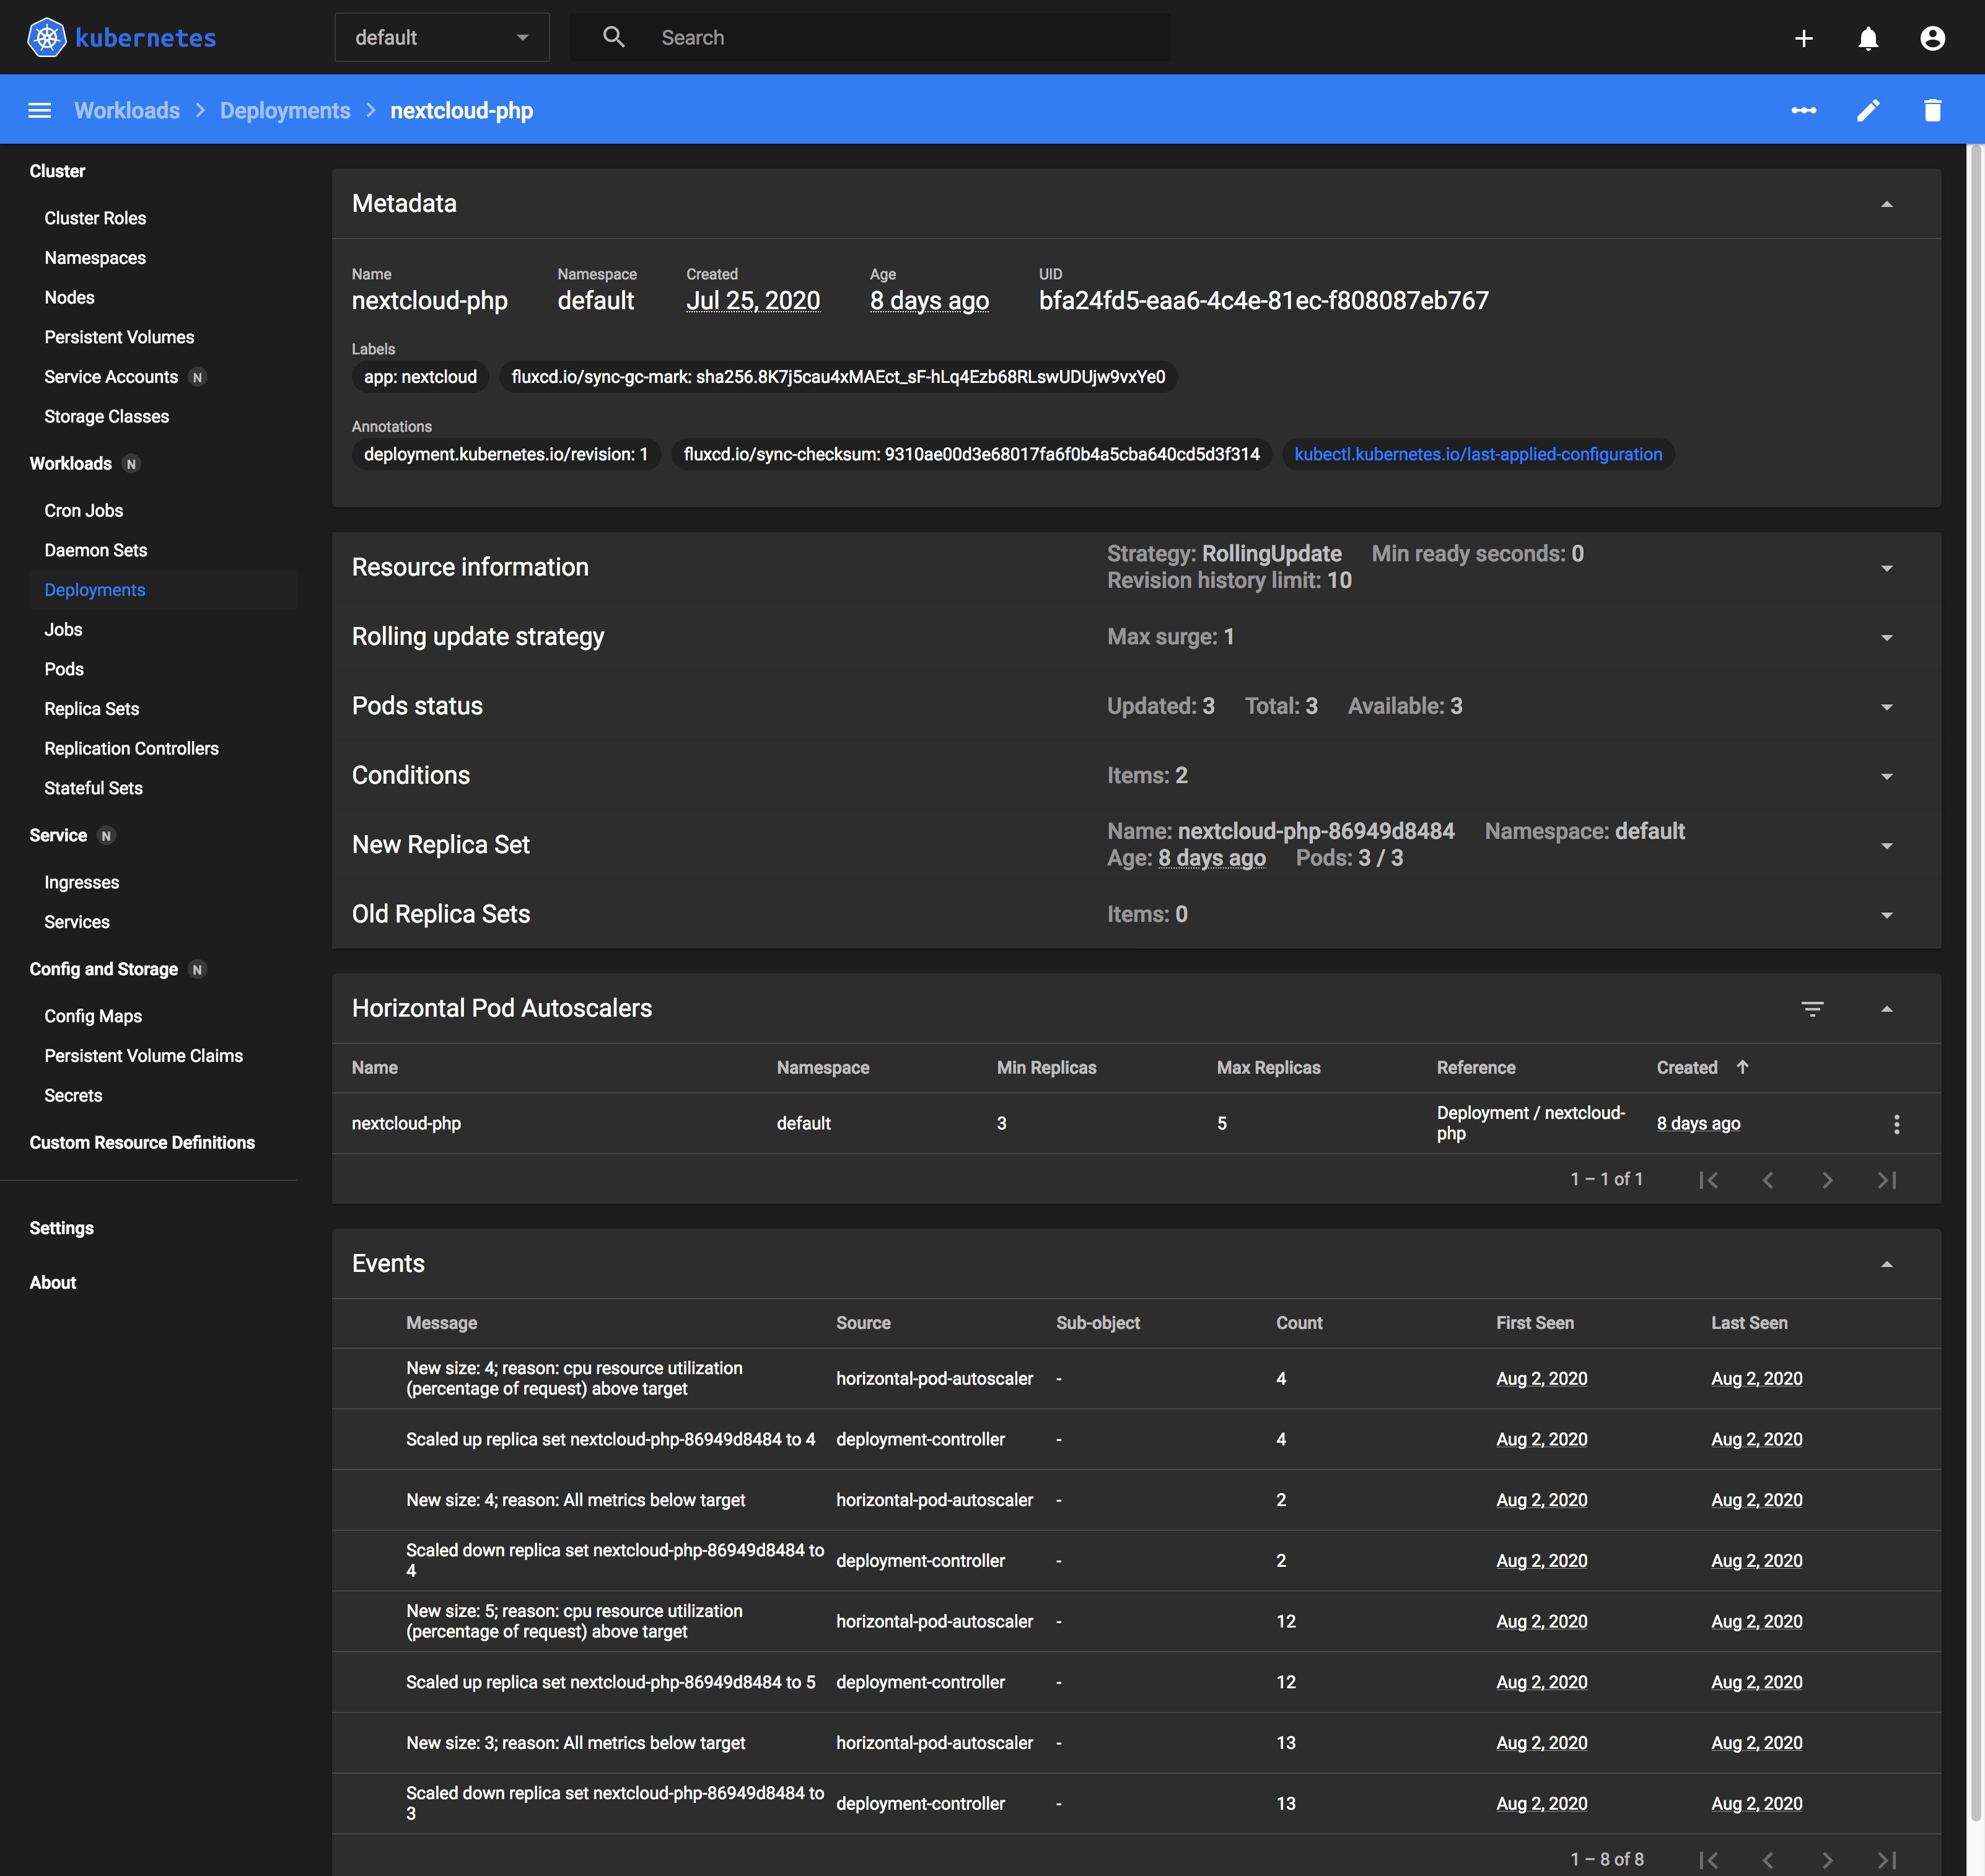
Logging state changes in your Deployments and Pods
How to install
There are only 2 steps to install the Kubernetes Dashboard:
- Download and deploy yaml manifests
- Create an admin user
Download and deploy yaml manifests
This step is very much simplified by the developers of the Kubernetes Dashboard to a single command:
$ kubectl apply -f https://raw.githubusercontent.com/kubernetes/dashboard/v2.0.4/aio/deploy/recommended.yamlCreate an admin user
To use the dashboard securely, you must create an admin user ServiceAccount, with which you obtain the token for and use that to access the dashboard.
Copy the following resource definitions into a text editor and save the file as dashboard-adminuser.yml
apiVersion: v1
kind: ServiceAccount
metadata:
  name: admin-user
  namespace: kubernetes-dashboard
---
apiVersion: rbac.authorization.k8s.io/v1
kind: ClusterRoleBinding
metadata:
  name: admin-user
roleRef:
  apiGroup: rbac.authorization.k8s.io
  kind: ClusterRole
  name: cluster-admin
subjects:
- kind: ServiceAccount
  name: admin-user
  namespace: kubernetes-dashboard
Deploy them to the cluster with:
$ kubectl apply -f ./dashboard-adminuser.ymlAfter the ServiceAccount has been created, obtain the token for the admin-user with:
$ kubectl -n kubernetes-dashboard describe secret $(kubectl -n kubernetes-dashboard get secret | grep admin-user | awk '{print $1}')Name: admin-user-token-ycqxf
Namespace: kubernetes-dashboard
Labels: <none>
Annotations: kubernetes.io/service-account.name: admin-user
kubernetes.io/service-account.uid: e7e2f1dd-7e5a-4665-90a4-7e98ea13ce67
Type: kubernetes.io/service-account-token
Data
====
ca.crt: 526 bytes
namespace: 20 bytes
token: iH70aiw4tGsJTjm8iLnkJdDy-IbzprSIu80fFOHRGxLfoi_tBou0SfD27AAzyTP6RSHLMX5aMWkQlfmLZvL-VPsGO4B9N24ds8NwSuj3bxi-R_aLaWWjAXVAjg90IzC-eQ9khdFOFOk9c6ihqr2-3RMtR6VO17jGBHyB9BAIwXdBe_l-oXb4uNEf2MDeCso0rw68m8CxX48Psou5jgKIHkUO3TKKt6IaBW49dmiQ7WTzcY9YQcany3FgirUTfQ0h2ALL65tbv-Q-BEHkpGqs-AmOpjlJtBF_NXqEC5M4HBYTUe_4ORpAvgLSU7HiNJzI_JkgFYknZ-Tup8dXpYIIHqyisnVdtB8wpOXdR8Brb-uNbrkpigFtW3Zhi0ZEBMWupRkECGx7sk4vdSZYzds4IuRSHeCU0MNFF1pXmw8e3oZCmAU-_1hwrPgru-TDiigcKO_wVYNTIF6wufRHd5GnHRQcAR8IRaGf06F0TL9aZel0F3dWlijkemLkVvcp76XEUE7Wz_8jdBKcecNghYmrEQpefoRB1e4kFkwaGGAZnq_4oFhZgk96Up3vx0jfM1xcz_oXkDYyzkIbNjFXvGnU29foAuTVfDKqlDmx9VxuafCbFnuWA1iXPwwbXfshPhGLwcrvWjWlev4K_3dTEqGG6rQe_gkMLelNmSh14mtTqc070enbtMu6wsZ2CpS5Knv-ml0y7zXzBIbTYtdreHujQLyk8mjw4LavhJHL1shg-P4n4kmnzMSSSkQDwHAXgmUMAna3sCQY0mkXBoC4Q8MocU2kXIe0VHZRb2fdPLZAUPPd0vqzrKXQPNDlST9XWeCb5D3ITMUm0Hhw613K4dCTe4s-VSLKwJuEEItgqVC9o5U1tfwTGGujXF1SBQh1UZAvZBfcZzRgdHOdq5a9AVEa-SDvs6LKPJ_eUcck7CGB6Wo4By34yfCopy the token and save it somewhere secure for the next step.
Accessing the dashboard
To access the dashboard securely, we must first set up a proxy through which we access the cluster's Kubernetes API Server:
$ kubectl proxy
Starting to serve on 127.0.0.1:8001Then navigate to http://localhost:8001/api/v1/namespaces/kubernetes-dashboard/services/https:kubernetes-dashboard:/proxy/ and you'll (hopefully) be greeted with the following page:
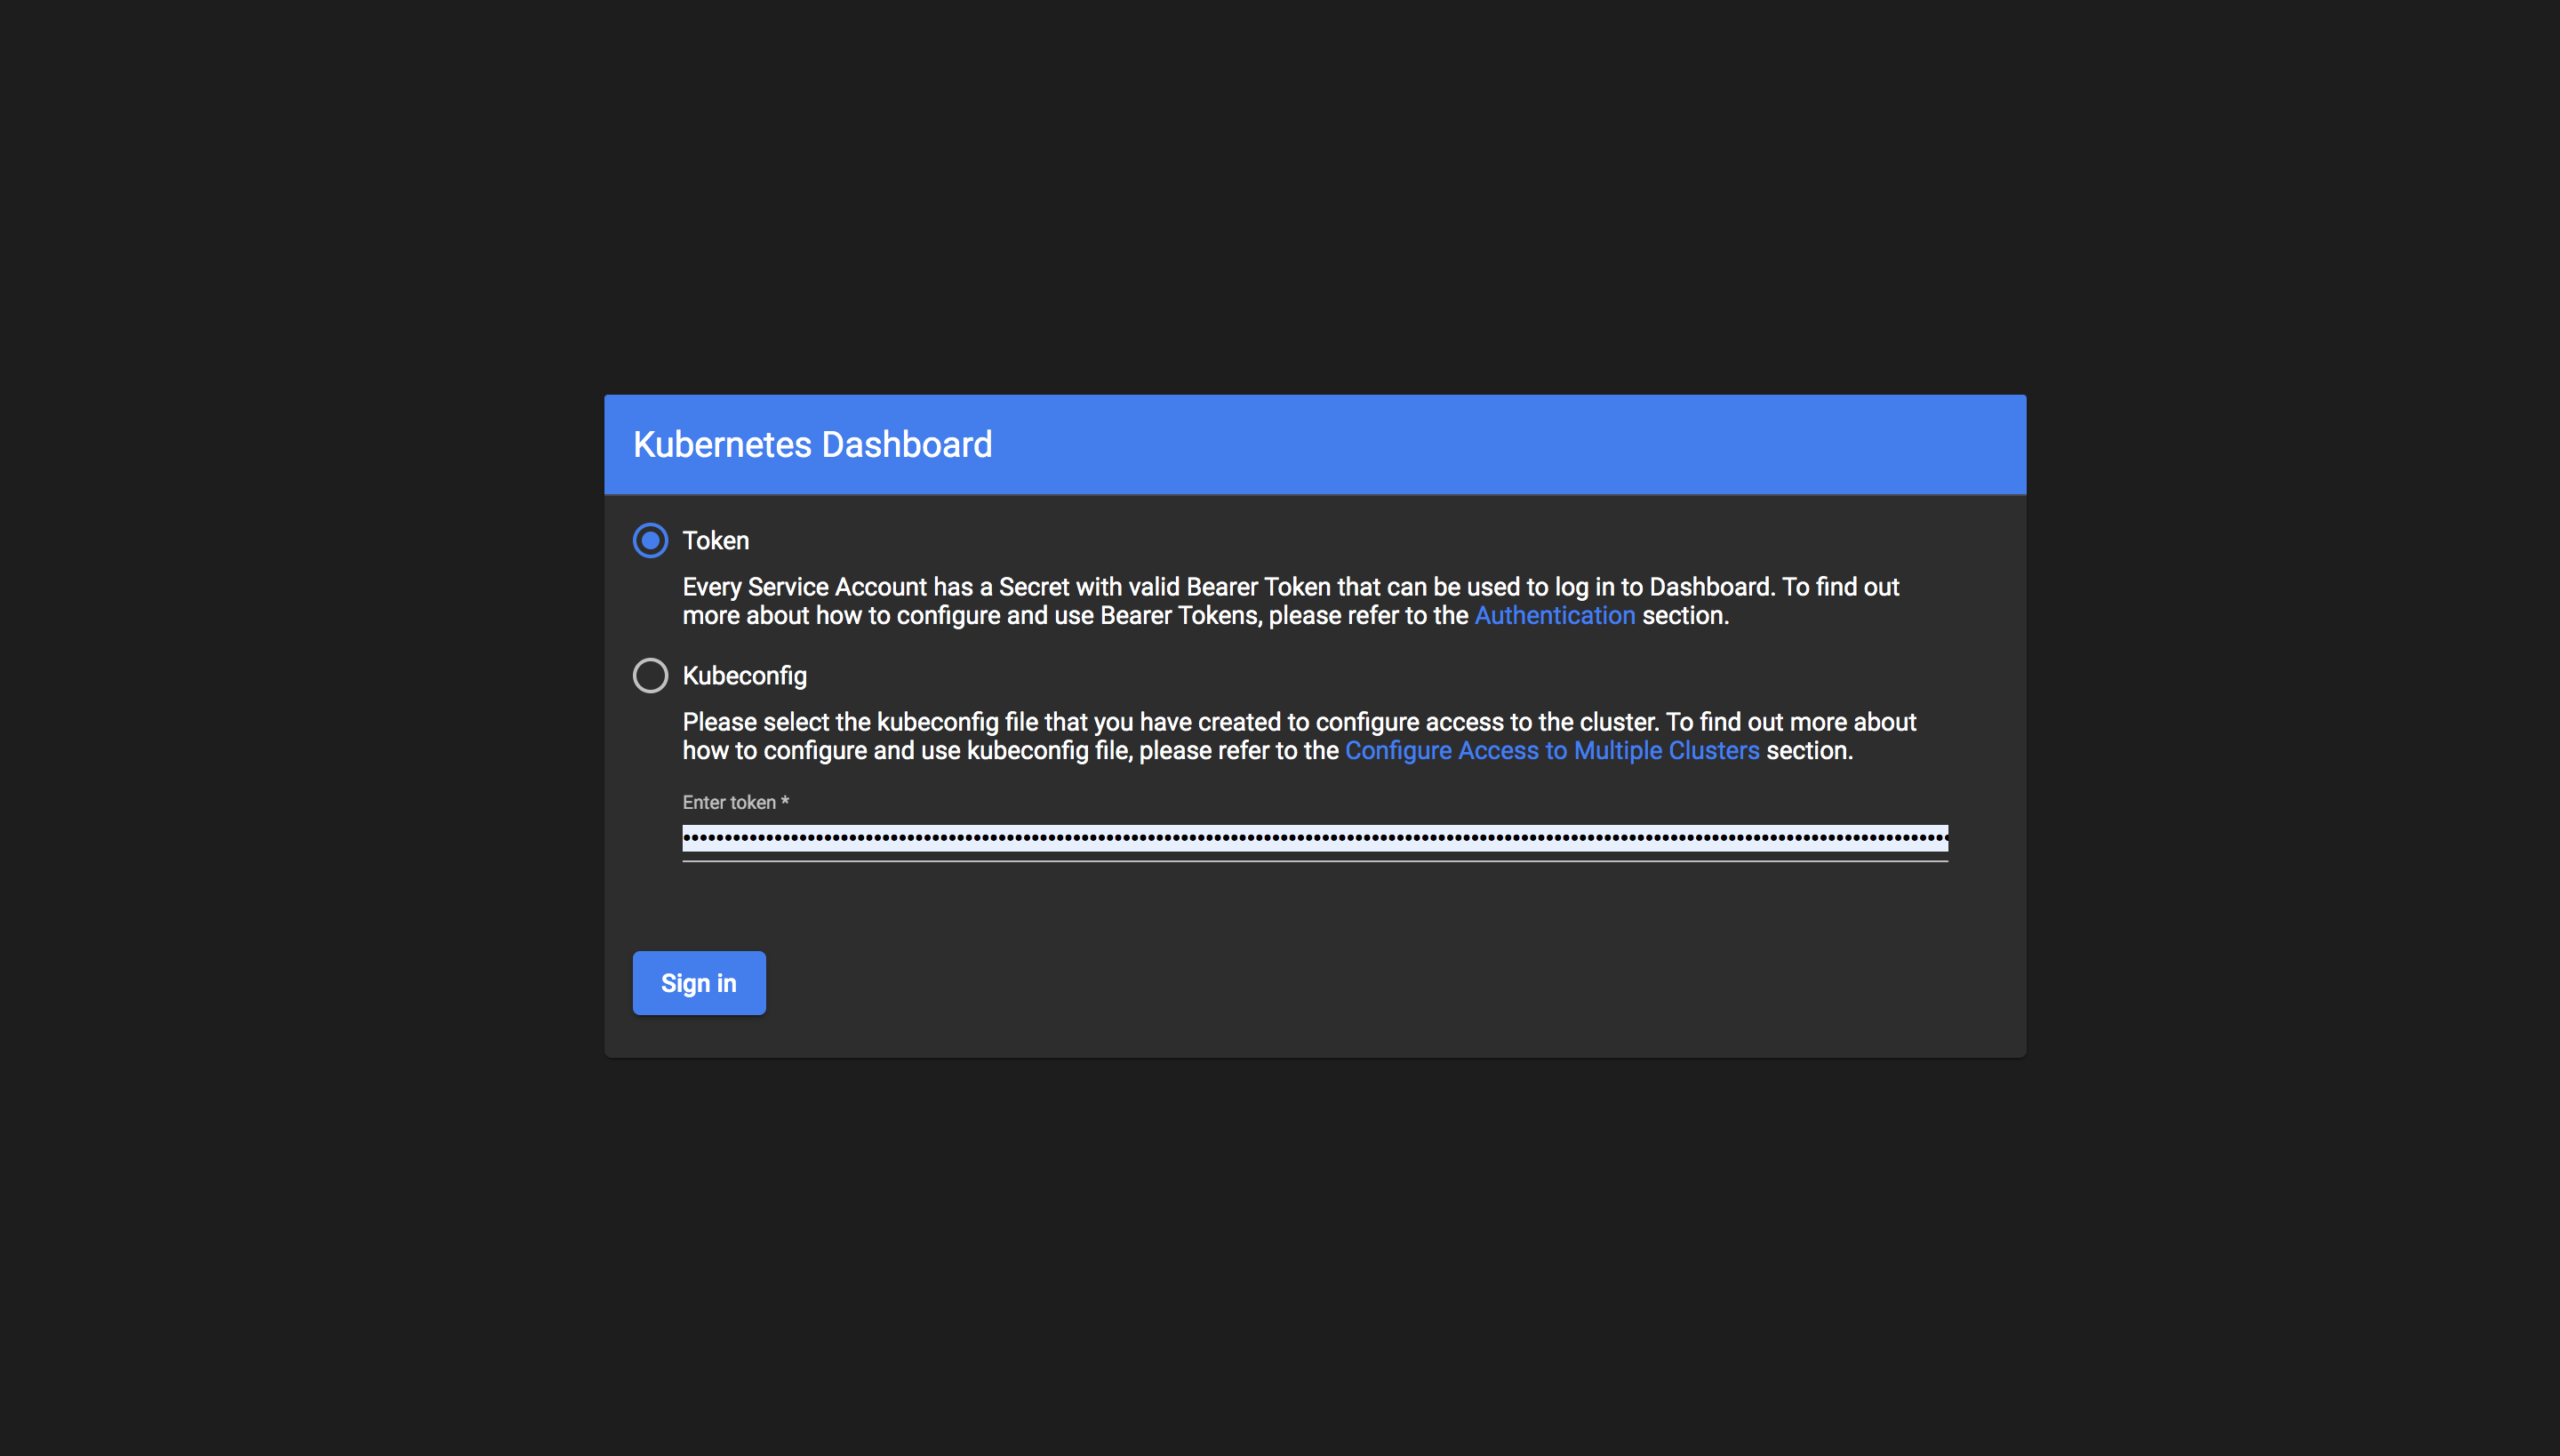
Ensure that the token login method is selected, paste the token obtained earlier in the first installation step into the field and click Sign In.
If you see something like the screenshot above, congratulations, you've successfully set up your own instance of the Kubernetes Dashboard! If not, consider retracing your steps and referring to the official guide for debugging.
Optional step for CPU/Memory metrics
If you have followed my previous guide on installing k3s on your cluster or are running k3s already, you're all set to see the CPU and Memory usage charts within the next few minutes while it initializes.
 Will Ho
If you are not running k3s, then there's a good chance that those charts won't be populated at all. In that case, you'll need to deploy the metrics-server app with the following command:
$ kubectl apply -f https://github.com/kubernetes-sigs/metrics-server/releases/download/v0.3.7/components.yamlMy experience
Given that Kubernetes is quite a complex beast and that I came from the comforts of using Portainer, the Docker Swarm equivalent UI, a dashboard was the first thing I desired when I was just getting started with running k3s on the Raspberry Pi cluster nearly 2 years ago.
The first thing I learnt was how to create resources on the cluster, but somehow I never learnt how to monitor, list, nor delete resources on the cluster until a few months later. It was through the use of the dashboard that I managed to keep my deployments in check.
Fast-forward to today, I perform most of my operations through the command line. I'm really only using the dashboard in the event where I'm unable to comprehend what is blocking the deletion of a resource, which I believe is a relatively common problem if you are using kubectl delete -f which ends up deleting only declared resources in yaml templates.
When it comes in handy
I was trying to delete and re-deploy AdguardHome from my cluster just yesterday, by running the following command:
$ kubectl delete -f ./production/adguard/
ingressroute.traefik.containo.us "adguard-0" deleted
ingressroute.traefik.containo.us "adguard-1" deleted
service "adguard-0" deleted
service "adguard-1" deleted
ingress.extensions "adguard-0" deleted
ingress.extensions "adguard-1" deleted
persistentvolume "nfs-adguard" deleted
persistentvolumeclaim "nfs-adguard" deleted
service "adguard-tcp-0" deleted
service "adguard-udp-0" deleted
service "adguard-tcp-1" deleted
service "adguard-udp-1" deleted
service "adguard-tcp" deleted
service "adguard-udp" deleted
service "adguard" deleted
statefulset.apps "adguard" deletedThis command deletes all resources that you have declared in yaml files in the directory, ./production/adguard/ but does not delete resources that are dynamically generated as a side-effect of creating those resources in the first place.
This is usually fine for the most part, however, as deletion of Deployments, StatefulSets and DaemonSets alike require dependencies, dynamically generated or not, to be deleted first, it waits forever at the last step.
Why that happened
In the StatefulSet for AdguardHome I have defined the following key:
  volumeClaimTemplates:
  - metadata:
      name: data
    spec:
      accessModes:
      - ReadWriteOnce
      resources:
        requests:
          storage: 500M
      storageClassName: nfs-nvme-128g
This generates a PersistentVolumeClaim data-adguard-i for each Pod the StatefulSet creates, where i is the ordinal number of the Pod in the StatefulSet, allowing for persistent state storage per Pod that is isolated from others.
These generated storage resources however, are not deleted in the earlier command as they are not defined in the yaml files, only the template is.
Manual deletion of generated resources
To correctly delete the StatefulSet, I still had to run the following commands to manually delete the generated PersistentVolumeClaims
$ kubectl delete pvc data-adguard-0
persistentvolumeclaim "data-adguard-0" deleted
$ kubectl delete pvc data-adguard-1
persistentvolumeclaim "data-adguard-1" deleted
Subsequently, I'll check the dashboard for PersistentVolumes in the Released state where their corresponding PersistentVolumeClaims have been deleted, and then manually delete them via the UI.

You may make the same mistake too
It's easy to forget about these generated resources if you, like me, subscribe to the design principle known as Infrastructure-as-Code (IaC). In IaC, the paradigm dictates that infrastructure resources can and should be defined as code, and that the state of the code reflects the state of the infrastructure resources at any point in time.
Dynamically generated resources break this design with volumeClaimTemplates, though that is out of necessity and convenience as it would be unsustainable to define one PersistentVolumeClaim per Pod.
It remains to be seen what the community will come up with to improve on adherence to the IaC paradigm, but what's for certain is that some extra visibility enabled by the Kubernetes Dashboard wouldn't hurt, whether or not you're an experienced user or a complete beginner.
What's next?
I'll be writing something up about how I deployed my very first self-hosted application, Nextcloud, on my Kubernetes cluster, and my experiences thus far with it. See you again!